


 Monetization
AI in Supply Chain: Real Numbers from Early Adopters
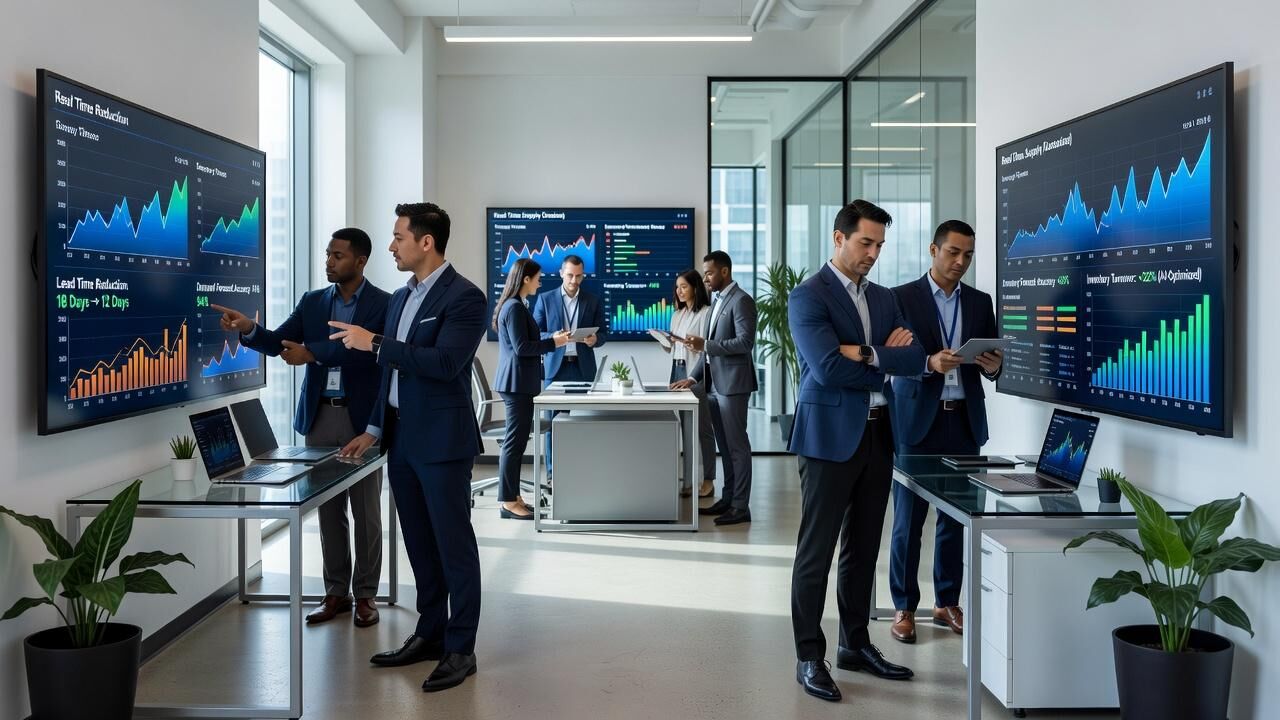
AI in Supply Chain: Real Numbers from Early Adopters
Traditional Supply Chain Inefficiencies
Supply chains have long operated with fragmented data flows and manual forecasting that produce consistent overstock and stockout rates. Industry baselines show average inventory carrying costs consuming 20-30% of total logistics spend when planning relies on spreadsheets and lagged signals. These gaps compound across multi-tier networks where a single demand misread can trigger excess production runs and expedited freight fees.
Early adopters moved away from these patterns by layering machine learning on top of existing ERP and telematics data. The shift did not eliminate human oversight but changed where that oversight is applied. Instead of reviewing every SKU weekly, teams now focus on exceptions flagged by models that surface within hours of new order or weather data arriving.
The financial drag from these legacy processes is measurable. Companies that delayed adoption reported average excess inventory write-downs of 4-6% of revenue in categories with high seasonality. That figure drops when models retrain daily on point-of-sale and supplier lead-time data rather than quarterly reviews.
Demand Forecasting Improvements at Scale
Amazon integrated neural network models into its replenishment engine and reported a 35% reduction in forecast error for high-velocity items over an 18-month period ending in 2022. The same models lifted in-stock rates from 92% to 97% for those SKUs while trimming safety stock holdings by 12%. Those changes translated into lower storage fees at fulfillment centers and fewer lost sales from empty shelves.
Walmart applied similar time-series models across its grocery network and achieved a 23% improvement in forecast accuracy for perishable categories within the first year of deployment. The result was a documented 18% drop in waste for produce and dairy combined. Procurement teams adjusted order quantities daily rather than weekly, cutting the lag that previously forced last-minute air freight.
Microsoft’s own internal supply chain for hardware components used gradient-boosted trees to predict component shortages. Over 24 months the approach reduced expedited shipping spend by 7 million compared with the prior baseline. The model incorporated supplier capacity signals scraped from public filings and port congestion data, allowing planners to shift orders 6-8 weeks earlier than before.
Inventory Optimization Outcomes
Reducing days of inventory on hand remains the clearest ROI lever. One consumer electronics manufacturer using reinforcement learning cut average inventory days from 68 to 51 within nine months. That shift freed 2 million in working capital without increasing stockout incidents above the prior 2.1% rate.
The same deployment showed that safety stock levels could be lowered 19% on components with stable lead times while raising them only on the 8% of parts flagged for geopolitical risk. The net effect was a tighter overall position rather than blanket reductions that ignore supply variability.
Companies that track both turns and service level together avoid the common trap of optimizing one metric at the expense of the other. The electronics case maintained a 99.1% fill rate while achieving the inventory reduction, a combination that spreadsheet methods rarely sustain past the first quarter.
Logistics Execution and Route Efficiency
UPS deployed its ORION routing algorithm, which incorporates real-time traffic and package volume data, and recorded a reduction of 100 million miles driven in a single year. Fuel and maintenance savings exceeded 00 million annually once the system reached full rollout across the U.S. network. Drivers received daily route adjustments rather than static plans, cutting overtime hours by an average of 4.2 per week per route.
FedEx applied computer vision at sort facilities to reroute packages dynamically. Mis-sort rates fell from 1.8% to 0.4% within six months, eliminating roughly 2.1 million unnecessary handling touches per quarter. The change also shortened average package dwell time inside hubs by 14 minutes.
These execution gains compound when upstream forecasts improve. Fewer rush orders mean fewer routes that must be rebuilt mid-day, which is where most of the mileage savings originate.
Supplier Risk and Resilience Metrics
Early adopters track supplier financial health and geopolitical indicators through models that ingest public data and shipment records. One automotive supplier reduced single-source exposure from 41% to 29% of critical parts after the model flagged concentration risk 11 months ahead of a key vendor’s liquidity event.
The same system cut the time required to qualify alternate suppliers from 14 weeks to 6 weeks by pre-scoring candidates on capacity, quality history, and logistics cost. That compression mattered when a typhoon closed three ports in Southeast Asia; the company shifted 37% of affected volume within 10 days instead of the 28 days recorded in a prior disruption.
Resilience is not free. The added monitoring layer increased supplier management costs by 3% but reduced expedited component purchases by 26% over the following two years. The net calculation favored the investment once the cost of line stoppages was included.
Case Study: P&G’s End-to-End Deployment
Procter & Gamble rolled out an integrated AI planning platform across its North American consumer goods network beginning in 2019. Within 30 months the company reported a 15% reduction in total supply chain costs, driven by a 22% drop in finished goods inventory and a 9% improvement in perfect order rate. The platform combined demand sensing, production scheduling, and transportation optimization in a single data model updated every four hours.
Before the change, P&G ran weekly planning cycles that relied on aggregated retailer orders. After deployment, daily POS feeds allowed the model to adjust production schedules for 68% of SKUs automatically. Planners intervened only on the remaining 32% where promotional or weather signals created outliers.
The financial impact included 80 million in annual working capital release and a 12% reduction in out-of-stock incidents at retail. The project paid for itself inside 14 months when measured against the prior baseline of manual S&OP meetings and static safety stock rules.
Implementation Realities and Timeline Expectations
Most successful deployments follow a 12- to 18-month path from pilot to scaled rollout. The first three months are spent cleaning and aligning data across ERP, WMS, and carrier systems. Without that step, model accuracy plateaus below 80% and adoption stalls.
Pricing for enterprise platforms ranges from 50,000 to .2 million in annual subscription fees depending on transaction volume and number of nodes modeled. The variable cost component often includes per-shipment or per-SKU charges that scale with usage rather than fixed headcount.
Teams that treat the rollout as a data infrastructure project rather than a pure analytics exercise reach positive ROI faster. The P&G case and similar programs at other large manufacturers show that the largest savings arrive only after daily data pipelines are stable and exception workflows are embedded in existing planner routines.
Measuring Ongoing Returns
Organizations that sustain gains track a narrow set of leading indicators: forecast bias, inventory turns by category, and expedited freight as a percentage of total spend. These metrics move ahead of the quarterly P&L and give operators time to adjust parameters before costs re-accumulate.
Annual model retraining on the prior 24 months of data prevents accuracy decay. Companies that skipped this step saw forecast error rise 8-11 percentage points within two years as market conditions shifted. The discipline of scheduled retraining is what separates one-time improvements from durable operating leverage.
The numbers from these early programs indicate that AI delivers measurable supply chain compression when data quality and process integration receive equal attention. The returns are not automatic, but the documented cases show consistent patterns once those prerequisites are met.
— Priya Sharma, Sylt.ingAbout the Author
Priya Sharma is a business AI strategist and analyst at Sylt.ing, focused on the intersection of artificial intelligence and business ROI. She has spent five years working with enterprise and SMB clients on AI adoption, automation strategy, and no-code implementation. Priya writes for operators and decision-makers who need to evaluate AI investments with clear metrics, not hype. Her analysis covers production AI deployments, agent systems, automation platforms, and the real costs behind enterprise AI transformation. Read more at sylt.ing/PriyaSharma.
 Italiano
 English
 Arabic
 French
 Spanish
 Portuguese
 Deutsch
 Turkish
 Dutch
Dutch
 Russian
 Romaian
 Portuguese (Brazil)
 Greek
Greek